All posts
Published September 17, 2026
Published September 17, 2026


A stationary vehicle no longer runs. But above all, he no longer contributes to the company's activity. The cost of downtime with a stationary vehicle far exceeds the repair bill: parts, labor and diagnostics are only part of the story. The real question for a car fleet is availability – and the KPIs that allow it to be measured.
However, when a vehicle breaks down or requires maintenance, the first instinct is often to look only at the amount of the bill. Towing, spare parts, workshop: these costs are easy to identify. They represent only part of the real cost.
While the vehicle is stationary, the company may also need to reorganize its operations, mobilize a replacement vehicle, change a route, reassign a driver or deal with a delay. How much does it cost for each day the vehicle is not available?
Immobilization is the period during which a fleet vehicle is not available for its missions - breakdown, workshop, waiting for parts, inspection or any other unavailability. The vehicle is in park, but it no longer works.
When a vehicle is immobilized, it is tempting to consider that it no longer generates operating expenses since it is not running. This is an incomplete vision. Even without being in circulation, the vehicle continues to have an economic impact.
Let's take a simple case. A vehicle breaks down Monday morning. He is sent to the workshop. The repair takes three days. The vehicle returns to the fleet on Thursday. During these three days: the vehicle does not carry out its missions; another resource must eventually replace it; the teams reorganize the schedule; certain operations may be delayed; the driver may need to be reassigned; the company may suffer an operating loss.
The maintenance invoice is visible. The cost of immobilization is much more difficult to perceive.
Direct costs — or visible costs — are those that are easily found in accounting documents or invoices: diagnosis, spare parts, labor, towing, subcontracting, rental of a replacement vehicle.
A company can therefore know precisely the price of a repair. This does not yet answer the essential question: what is the total cost of downtime?
Indirect costs — or hidden costs — are much more difficult to measure: loss of operational capacity, management time, delay in missions, disorganization, reallocation of resources, impact on the client.
It is this second category which makes the analysis particularly complex. The number of vehicles in a fleet is not enough to measure its real capacity. On paper, a fleet of 100 vehicles. If 10 are immobilized: 90 vehicles actually available. This difference is fundamental. The manager must monitor not only the size of his fleet, but also its level of availability.
There is no universal amount. The cost depends on the activity of the company, the type of vehicle, its use and the mission it was to carry out. However, we can reason with a simple formula:
Daily downtime cost = (direct costs + indirect costs) / number of days of downtime
In other words: compare the cost of the intervention to the duration of immobilization, then add the daily components which continue to weigh as long as the vehicle is not returned to service (replacement, lost capacity, coordination time).
The amounts below are aillustrative example. They constitute neither a market average, nor a Digiparc figure, nor a general statistic. They are only used to show how to add daily components.
Illustrative example:250 MAD + 400 MAD + 600 MAD = 1,250 MAD/day.
In this fictional example, the three positions represent possible daily components (e.g. replacement, operational impact and management time). Each fleet must replace these assumptions with its own actual costs. Without this caution, we confuse a calculation exercise with a place indicator.
| Job | Examples |
|---|---|
| Maintenance cost | Diagnostics, parts, labor, towing, subcontracting |
| Replacement cost | Temporary rental, reassignment of another vehicle |
| Operational cost | Reduced capacity, postponed missions, modified tours |
| Organizational cost | Management time, coordination, planning, team information |
A simple rule applies to fleet management: you can't really improve what you don't measure. To reduce the impact of downtime, we must first understand their frequency, duration and causes.
| Indicator | Question |
|---|---|
| Immobilized vehicles | How many are currently unavailable? |
| Duration of immobilization | How long ago? |
| Maintenance cost | How much does the procedure cost? |
| Availability | How much of the fleet is available? |
| Failure frequency | Which vehicles regularly experience problems? |
| Average downtime | How long does it take on average to return a vehicle to service? |
The performance of a fleet is not measured solely by the number of vehicles it owns. It is also measured by its ability to keep these vehicles available and operational – cost, duration, frequency, availability, impact on activity. It is also the link with theTCO: a stationary vehicle continues to weigh on the total cost of ownership, even if it is not running.
Maintenance should not be viewed solely as an expense. It directly contributes to the availability of the fleet. HASmaintenance managementcorrectly monitored makes it possible to better manage preventive and curative interventions, plans, histories, costs, deadlines and downtime.
The goal is not to eliminate all breakdowns. It is to better control their impact on operations. Not all downtime can be avoided: some repairs are complex, some parts require time, some interventions require expertise. But the downtime duration also depends on the organization: has the problem been identified? Is the history accessible? Is the part available? Is the intervention planned? Does the manager know immediately which vehicles are immobilized?
A fleet produces a lot of information: vehicles, mileage, maintenance, interventions, costs, documents, assignments and availability. When this information is scattered – Excel spreadsheet, WhatsApp messages, emails, paper files – it becomes difficult to quickly understand the real situation of the park.
Each missing piece of information complicates decision-making. We can know the price of a repair without knowing how many days the vehicle has been stationary, nor what the daily cost is. Visibility of the fleet then becomes an operational lever.
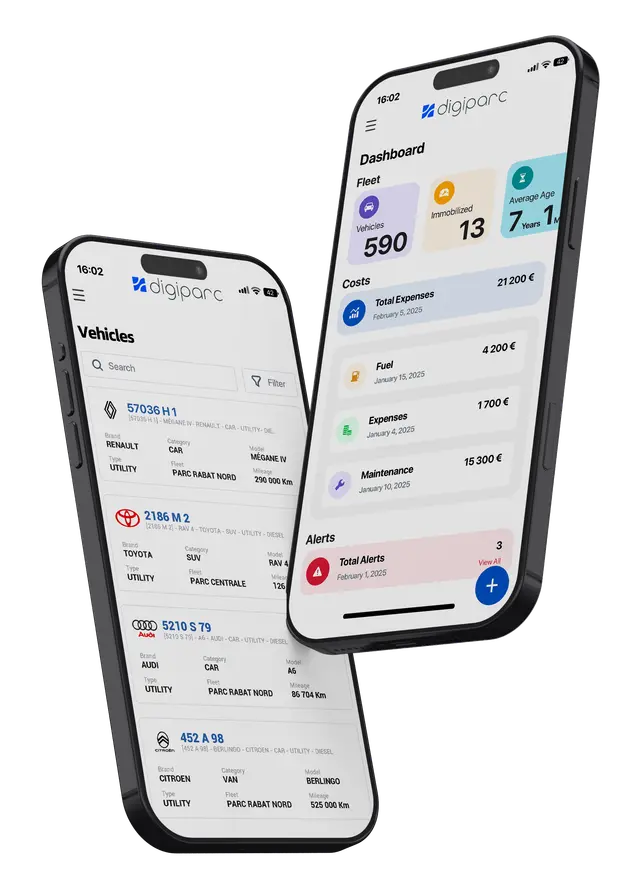
It is here that afleet management softwarechanges the nature of the problem: not “hiding” the fixed asset, but making it readable. Digiparc makes it possible to centralize data related to fleet management in order to have a clearer vision of vehicles and their activity.
The manager can thus better monitor vehicles, interventions, maintenance costs, histories, immobilization situations and fleet availability. The objective is simple: no longer just notice that a vehicle is immobilized, but have the information necessary to understand the situation and act.
Centralizing data is a first step. The real value appears when this data allows you to make better decisions: vehicles that concentrate costs, longer-than-average stops, repeated causes. Data raises relevant questions — and these questions guide action.
An immobilized vehicle does not only cost the price of its repair. It can also represent wasted time, reduced operational capacity, replacement vehicle, delays, disorganization and costs that are difficult to measure.
This is why downtime must become an indicator in its own right of fleet performance. The first step is to have a clear vision: which vehicle, which intervention, what duration, what cost, what availability?
Your vehicle is stationary. The real question isn't just how much it costs to repair. The real question is: how much is it costing you each day it's not available?
Digiparc centralizes this data to give the manager a more structured vision of its fleet and its maintenance operations. To explore the subject further, theDigiparc white paper on capital costsdetails the availability levers. To talk to an expert:request an appointment.