Module · GPS
Average Consumption
Average Consumption
Introduction
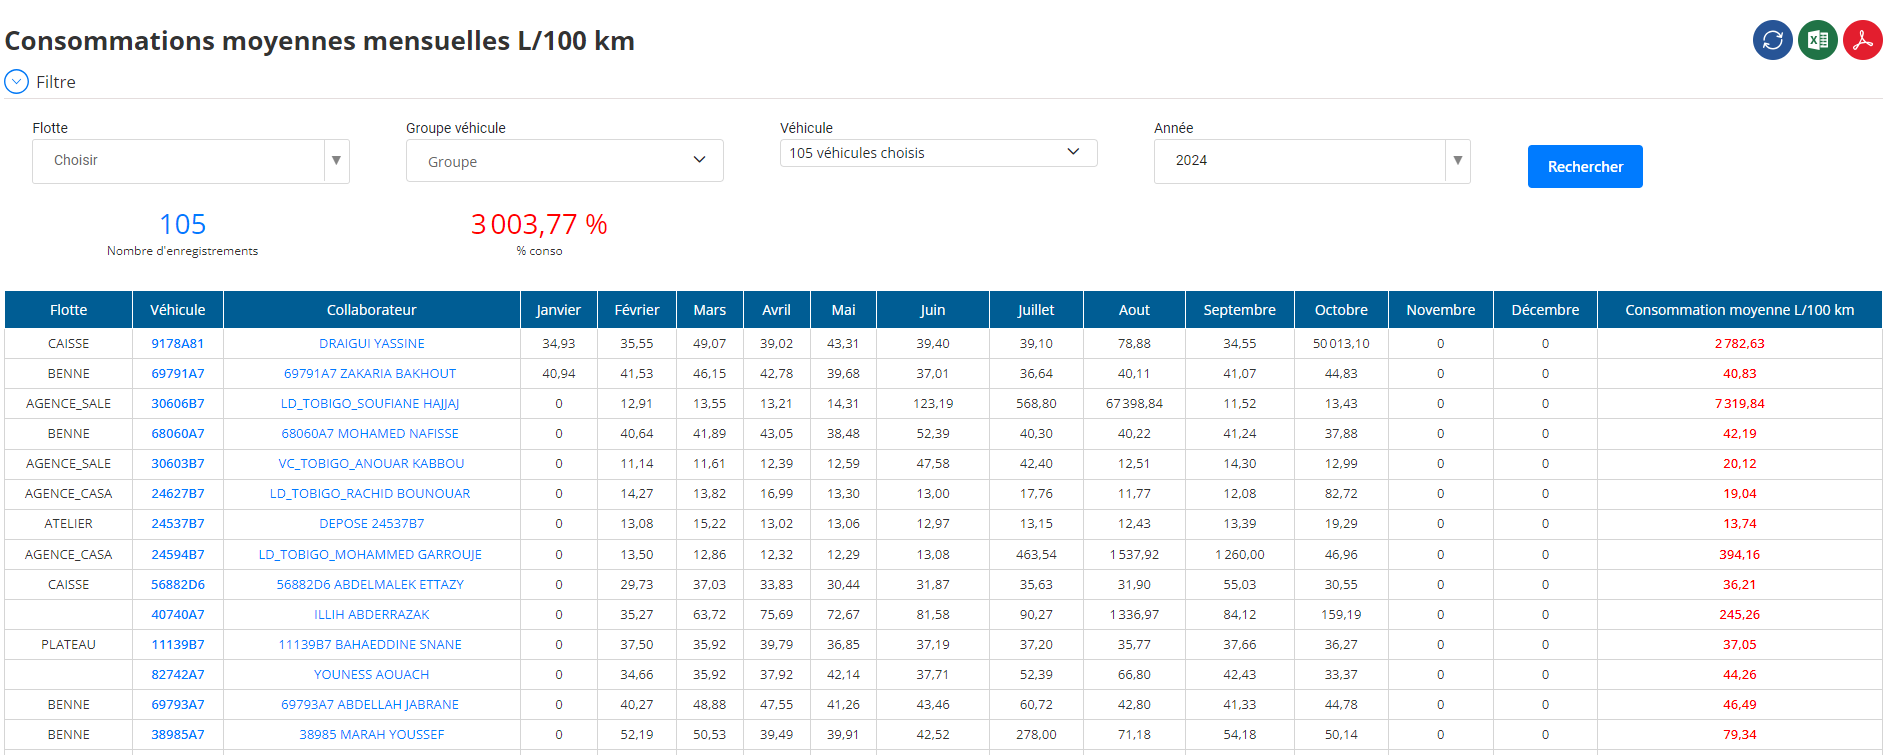
L'monthly average consumption report interfaceoffers a detailed view of the energy efficiency of each vehicle on a monthly basis. It is essential for fleet managers wishing to closely monitor average consumption inliters per 100 km (L/100 km)of their vehicles. Using this table, it is possible to identify performance gaps, anticipate maintenance needs, and reduce fuel costs.
Filters
The interface offers several filters to allow precise targeting of the analysis and thus personalize the report according to needs:
- Fleet: Selects one or more specific fleets to analyze.
- Vehicle group: Refines the search by vehicle group.
- vehicle: Allows you to isolate one or more specific vehicles for a targeted evaluation.
- Year: Limits the display to a specific year, facilitating annual analysis.

These filters allow maximum flexibility to evaluate subgroups or specific periods, and thus better understand variations in consumption.
Results Table
The results table presents a detailed month-by-month view as well as an annual summary:
- Fleet: Indicates the fleet to which the vehicle belongs.
- vehicle: Registration or unique identifier of the vehicle.
- Collaborator: Driver or regular user of the vehicle.
- January to December: Displays the average fuel consumption in liters per 100 km (L/100 km) for each month.
- Annual Average Consumption (L/100 km): Automatic calculation of the annual average over all months.
Each monthly column helps identify consumption peaks at specific periods, helping to detect anomalies or inefficient behavior.
Features
-
Advanced Filtering:
Filters allow you to analyze the consumption of a group of vehicles or an individual vehicle for a given year, thus offering customization of the report according to operational needs. -
Month by Month View:
Each monthly column makes it possible to monitor variations in consumption over the months, making it easier to identify unusual consumption (e.g.: increase in winter). -
Automatic Calculation of the Annual Average:
A dedicated column presents theannual averageof consumption, giving an overall indicator of energy performance. -
Exporting Data to PDF and Excel:
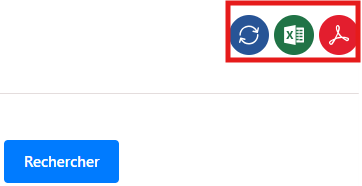
The report can be exported asExcelGoldPDF, facilitating sharing with other departments (financial, operational) and allowing in-depth analysis outside the application.
Goals
The monthly average consumption report interface is an essential tool for:
- Cost Optimization: By identifying vehicles with high consumption, managers can plan maintenance actions or consider renewing certain vehicles.
- Analysis of Driving Behaviors: Variations in consumption can reveal inefficient driving behaviors (e.g. sudden acceleration) which can be corrected through appropriate training.
- Budget Management: By anticipating consumption trends, teams can better predict the fuel budget for the following year.
- Detection of Faults or Malfunctions: Unexpected consumption peaks may signal a technical problem requiring rapid intervention.
- Ecological Monitoring: By promoting eco-responsible conduct, this interface also contributes to reducing the company's carbon footprint.
Conclusion
This interface constitutes a pillar for effective fleet management by allowing rigorous analysis of energy performance. It helps to anticipate fuel needs and optimize the daily operation of vehicles.