Module · GPS
Passage Zones
Passage Zones
Introduction
Le rapport Passage par Zone est une interface essentielle pour le suivi et la gestion des déplacements de la flotte. Elle permet de tracer les trajets effectués par les véhicules entre différentes zones définies et d’enregistrer les informations clés liées à chaque passage. Ce rapport offre aux gestionnaires une vue complète des mouvements de leurs véhicules et facilite la détection d’irrégularités ou d’opportunités d’optimisation.
Exportation en PDF et Excel
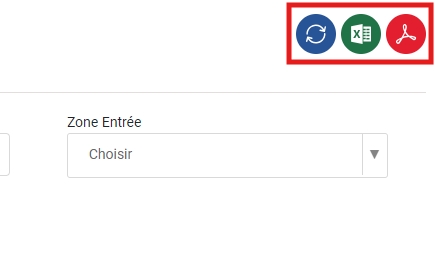
Les données du rapport peuvent être facilement exportées en PDF ou Excel, permettant une analyse plus approfondie hors de l’interface. L'export Excel offre notamment la possibilité de créer des graphiques, des tableaux croisés dynamiques, et d’effectuer des comparaisons statistiques. Ces fonctionnalités facilitent également le partage des résultats avec d’autres départements ou partenaires externes.
Filtrage Avancé
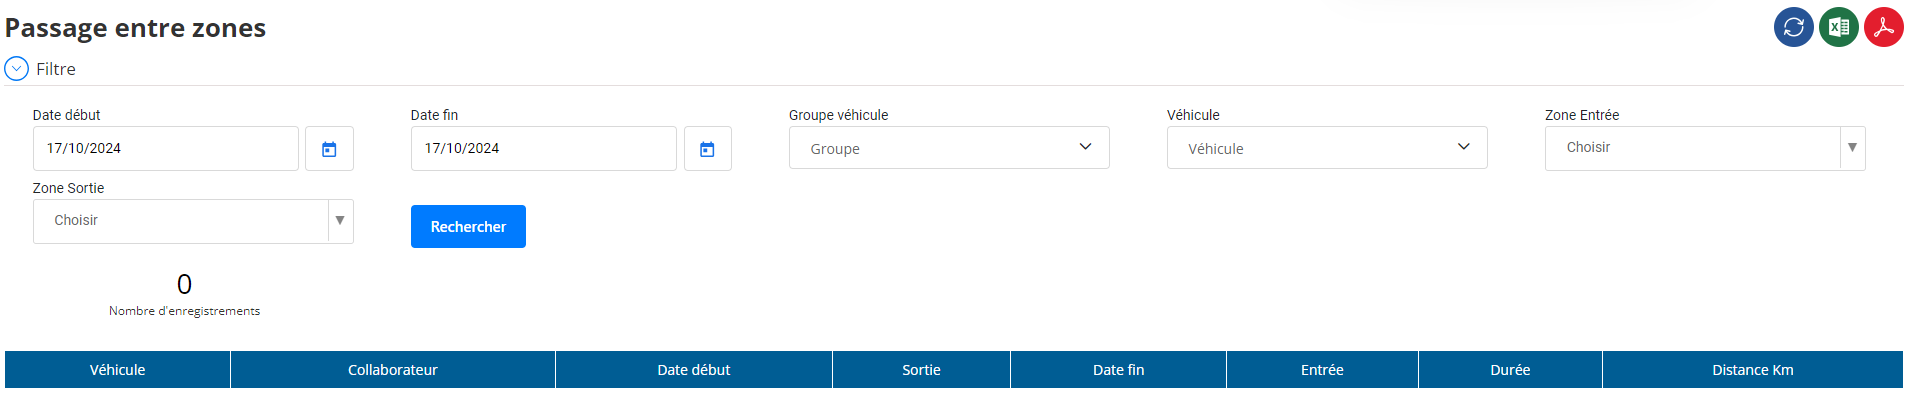
L'interface propose plusieurs filtres pour personnaliser l’affichage des données. Les utilisateurs peuvent sélectionner une période spécifique à l'aide des filtres de date de début et date de fin. Ils peuvent également restreindre l’analyse à un groupe de véhicules, à un véhicule particulier, ou encore à des zones d’entrée et de sortie spécifiques, offrant ainsi une grande flexibilité pour l’exploration des données.

Visualisation des Trajets Interzones
L'interface fournit une vue détaillée de chaque déplacement réalisé entre les zones. Elle identifie pour chaque passage la zone d'origine, la zone d'arrivée, ainsi que l'heure et la date associées. Cette fonctionnalité aide les gestionnaires à suivre les itinéraires empruntés et à analyser les comportements de déplacement.
Suivi des Conducteurs et des Véhicules
Chaque enregistrement est associé à un conducteur spécifique, ce qui permet d’évaluer l’efficacité de la conduite et de détecter d’éventuels écarts ou comportements inappropriés. En suivant également les véhicules utilisés, il devient possible d'identifier les véhicules les plus actifs ou ceux qui rencontrent le plus de difficultés.
Mesure du Temps et des Distances
Le rapport calcule automatiquement la durée de chaque trajet, c’est-à-dire le temps écoulé entre la sortie d'une zone et l’entrée dans une autre. Il enregistre aussi la distance parcourue en kilomètres. Ces informations sont précieuses pour évaluer la productivité des véhicules, détecter des arrêts prolongés ou identifier les trajets inefficaces.
Optimisation des Itinéraires et Performance Logistique
En analysant les zones fréquemment traversées et les temps de déplacement, les gestionnaires peuvent repérer des opportunités d’amélioration. Cela inclut l’optimisation des itinéraires pour réduire la consommation de carburant ou le temps de trajet, et l’identification de nouvelles zones à éviter en cas d’encombrement récurrent.
Détection des Anomalies et des Fraudes
Le rapport permet de détecter des anomalies comme des passages imprévus dans des zones non autorisées ou des trajets inhabituels. Ces informations peuvent aider à repérer d'éventuelles fraudes ou des erreurs opérationnelles, par exemple lorsqu'un véhicule effectue des arrêts non planifiés.
Comparaison par Période
La capacité de filtrer les trajets par date permet de comparer les performances entre différentes périodes. Cela peut aider les gestionnaires à identifier des tendances, comme une augmentation de l’activité sur une période donnée ou une baisse de la performance dans certaines zones.