
Module · GPS
Recherche Trajets
Recherche Trajets
Introduction
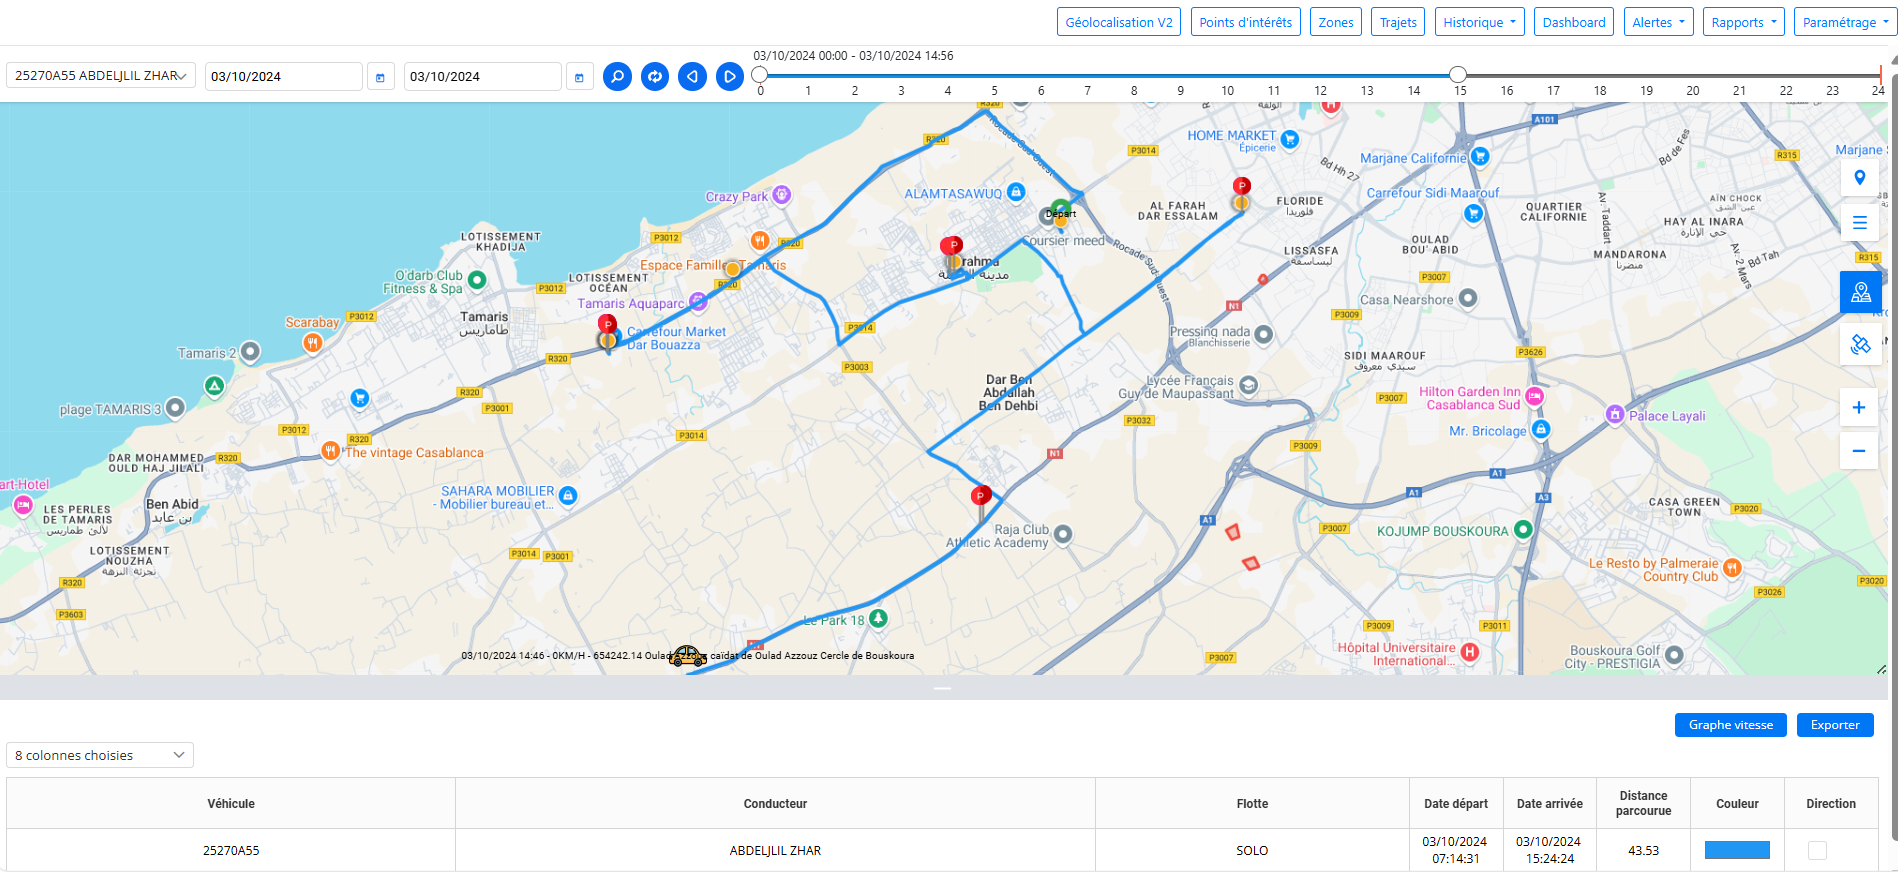
L'interface Recherche Barrede Digiparc offre une vue intuitive et précise des trajets effectués par un véhicule sur une journée complète. En sélectionnant un véhicule et une date, le trajet total pour la journée choisie est automatiquement généré sur la carte, offrant une vue détaillée de tous les mouvements du véhicule.
Barre de Temps Interactif
L'élément central de cette interface est une barre temporelle, allant de00h00 à 23h59, qui permet de suivre le parcours du véhicule tout au long de la journée. L'utilisateur peut manipuler cette barre de manière fluide en glissant le curseur le long de l'échelle temporelle. À mesure que le curseur avance ou recule dans le temps, le véhicule se déplace sur la carte en temps réel, permettant de visualiser avec précision où il se trouvait à chaque moment de la journée.
Mode d'Affichage Historique
Ce mode d'affichage est spécifiquement conçu pour fournir unaperçu historique des déplacements. Grâce à cette fonctionnalité, les gestionnaires peuvent revivre la journée complète du véhicule, en analysant ses arrêts, ses trajets, et ses déplacements en temps réel. Cela permet d'identifier des périodes d'activité, de vérifier la conformité avec les itinéraires prévus, ou encore de comprendre les raisons de certaines anomalies dans le trajet.
Barre de Recherche Temporelle
La première fonctionnalité clé de l'interfaceRecherche Barreest labarre de recherche temporelle. Cette barre représente l'intervalle de temps allant de00h00 à 23h59, couvrant toute la journée d'activité du véhicule. Elle permet à l'utilisateur de visualiser et manipuler le déplacement du véhicule sur la carte en fonction du moment précis de la journée.

Manipulation Bidirectionnelle
- Glissement vers la droite (avant): En faisant glisser la barre vers la droite, vous avancez dans le temps, permettant de suivre le trajet du véhicule tel qu'il s'est déroulé. Cela donne un aperçu des trajets à différents moments de la journée, jusqu'à l'heure actuelle ou la fin de la période sélectionnée.
- Glissement vers la gauche (arrière): En glissant la barre vers la gauche, vous revenez en arrière dans le temps, permettant d'observer les déplacements passés du véhicule. Cela est utile pour revoir des points d’arrêt ou des segments de trajet spécifiques.
Boutons de Flèche pour Manipulation Précise
En complément de la barre de recherche temporelle, l'interfaceRecherche Barreinclut desboutons de flèchequi permettent une manipulation plus précise du temps. Ces flèches offrent une solution pour ajuster le déplacement du véhicule avec unegranularité de deux minutes.

Fonctionnement des Boutons de Flèche
- Flèche vers la droite: Chaque clic sur la flèche droite fait avancer la barre de2 minutes, permettant de visualiser le véhicule progressant sur son trajet avec plus de précision.
- Flèche vers la gauche: En appuyant sur la flèche gauche, la barre recule de2 minutes, permettant de revoir les événements passés minute par minute.
Avantages
- Contrôle Granulaire: Les flèches offrent un contrôle plus précis qu'un glissement manuel, permettant d'ajuster les déplacements à des intervalles courts.
- Analyse Détaillée: Cette fonctionnalité est particulièrement utile pour analyser des moments spécifiques du trajet, comme des arrêts ou des virages, avec une précision temporelle accrue.
Actualisation des Filtres
L'interfaceRecherche Barreest équipée d'une fonctionnalité pratique sous forme d'unbouton d'actualisation, qui permet de réinitialiser tous les filtres appliqués. Ce bouton est essentiel pour les utilisateurs souhaitant effectuer une nouvelle recherche sans devoir manuellement désélectionner les filtres déjà en place.

Filtre de Recherche par Véhicule et Date
L'interfaceRecherche Barrepropose une fonctionnalité essentielle defiltre de recherche par véhicule et date, permettant aux utilisateurs de consulter l'historique de déplacements d’un véhicule spécifique sur une période donnée. Ce filtre est conçu pour offrir une navigation rapide et efficace à travers les trajets enregistrés.

Tableau Informatif Personnalisable
Le tableau informatif situé en bas de l'interfaceRecherche Barrepropose une vue détaillée des trajets des véhicules via8 colonnespersonnalisables. Vous pouvez choisir d'afficher ou de masquer ces colonnes selon vos besoins.

Les Colonnes
- Immatriculation du Véhicule: Affiche la plaque d'immatriculation de chaque véhicule, essentielle pour identifier les véhicules suivis.
- Conducteur: Indique le conducteur associé au véhicule, permettant de filtrer par conducteur.
- Flotte: Montre à quelle flotte appartient chaque véhicule, utile pour les véhicules organisés en groupes.
- Date de Départ: Correspond au premier départ du véhicule durant la date choisie.
- Date d'Arrivée: Indique le dernier arrêt du véhicule pour la journée sélectionnée.
- Distance Parcourue: Affiche la distance totale parcourue par le véhicule en kilomètres pendant la période donnée.
- Personnalisation de la Couleur: Donne la possibilité de changer la couleur du tracé du trajet pour chaque véhicule, facilitant la distinction visuelle sur la carte.
- Checkbox Direction: En cochant cette case, des flèches sont générées sur le trajet pour indiquer la direction du véhicule.
Personnalisation
Les utilisateurs ont la possibilité decocher ou décocherles colonnes selon leurs préférences, permettant une vue plus claire et ajustée à leurs besoins spécifiques.
Graphe de Vitesse
L'interfaceRecherche Barreinclut également une fonctionnalité degraphe de vitesse, positionnée au même emplacement que le tableau informatif. Un simple bouton permet debasculerentre le tableau des informations et ce graphique, offrant ainsi une vue alternative et complémentaire pour analyser les trajets.

Présentation du Graphe de Vitesse
Le graphe est ungraphique à deux axes:
- Axe vertical (Y): Représente lavitessedu véhicule enkilomètres par heure (km/h), permettant de suivre les variations de vitesse tout au long du trajet.
- Axe horizontal (X): Représente letempsen heures et minutes, couvrant toute la période sélectionnée dans la recherche.
Objectif du Graphe de Vitesse
Le graphique de vitesse est conçu pour :
- Visualiser les Fluctuations de Vitesse: Permet de repérer facilement les accélérations soudaines, les freinages brusques ou les périodes d’arrêt prolongé.
- Analyser le Comportement du Conducteur: La courbe de vitesse offre un aperçu large du style de conduite, aidant à identifier des comportements à risque ou à optimiser les trajets.
Basculer entre Tableau et Graphe
Grâce au bouton de bascule, l’utilisateur peut facilementalternerentre la vue en tableau (pour une analyse détaillée des données) et la vue engraphe(pour une représentation visuelle rapide). Cela permet d’avoir unedouble perspectivesur le même trajet, améliorant ainsi la capacité d’analyse et d’interprétation des données.
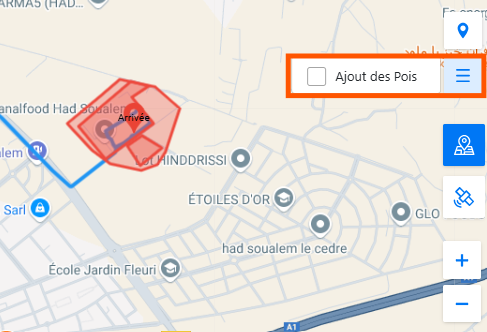
Affichage ou Désaffichage des Zones et Points d'Intérêt
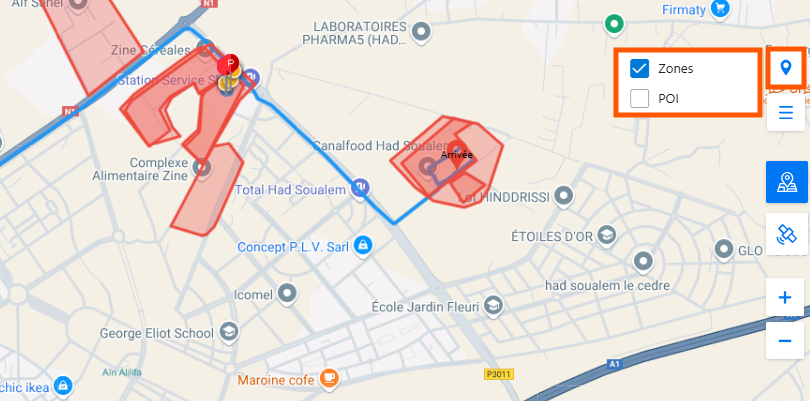
Dans l'interface Recherche Barre, une fonctionnalité pratique permet de gérer l'affichagedes zoneset des points d'intérêt (POI)directement sur la carte. Cette option est intégrée pour offrir une personnalisation optimale de l’affichage en fonction des besoins spécifiques de l'utilisateur.
Affichage ou Masquage des Zones
Les zones préalablement tracées sur la carte peuvent être affichéesou désactivées. Cette fonctionnalité permet :
- De concentrer l'analysesur les trajets sans distraction, en masquant temporairement les zones qui ne sont pas nécessaires pour la visualisation actuelle.
- D'afficher les zonespour voir l'interaction du véhicule avec des périmètres définis, comme la gestion des vitesses maximales ou les alertes de surveillance.
Affichage ou Masquage des Points d'Intérêt (POI)
Similairement aux zones, les points d’intérêtpeuvent être masquésou affichés. Cela aide à :
- Optimiser la visualisationen allégeant la carte de certains POI qui ne sont pas pertinents pour l’analyse du moment.
- Activer l’affichagedes POI pour voir précisément quels véhicules interagissent avec ces points spécifiques, utile pour vérifier les passages enregistrés dans les rapports de POI.
Utilisation
- L'utilisateur peut cocherou décocherles cases associées aux zones et POI dans les options d'affichage pour ajuster la carte.
- Cela permet d’adapter la carteaux besoins d’analyse, rendant les informations plus claires et pertinentes pour les trajets en cours d’exploration.
Ajout de Point d'Intérêt (POI)
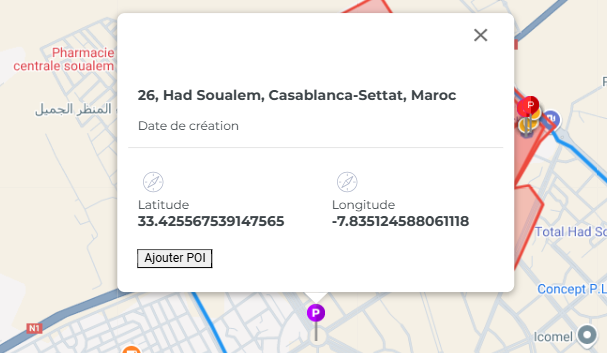
Dans l'interface Recherche Barre, la fonctionnalité Ajout de Point d'Intérêt (POI)permet d'enregistrer un emplacement en un simple clic sur la carte. Dès que l'utilisateur clique sur un point, le système génère automatiquement l'adresse, ainsi que les coordonnées de latitude et de longitudede cet emplacement.
Étapes d'Ajout d'un POI:
- Génération Automatique des Coordonnées:
- Lorsque l'utilisateur clique sur la carte, la position exacte est calculée et les informations d'adresse, ainsi que les coordonnées (latitude, longitude), s'affichent instantanément dans le pop-up.
- Ouverture du Pop-up Informatif:
- Le pop-ups'ouvre automatiquement avec les informations générées et inclut également un bouton pour ajouter le POI.
- Ajout de POI:
- L'utilisateur peut alors compléter les champs du POI(nom, groupe, type, icône, distance d'alerte, etc.) déjà discutés précédemment.
- Un simple clic sur le bouton d'ajout POIpermet d'enregistrer ce point dans la carte et de le sauvegarder avec les informations personnalisées.
Processus d'Ajout de POI
- Sélection d'un Emplacement: L’utilisateur peut simplement cliquersur un emplacement spécifique de la carte où il souhaite ajouter un POI.
- Affichage d'une Fenêtre Pop-up: Un pop-ups'ouvre alors, affichant un formulairepour la création du POI.
- Saisie des Informations du POI:
- Nomdu POI : Permet de nommer ce point pour l'identifier facilement.
- Groupe et Type: L'utilisateur peut assigner le POI à un groupeou définir un typepour mieux le catégoriser. Ces catégories sont définies par l'utilisateur pour organiser les POI de manière plus efficace.
- Icône de Personnalisation: Le choix d'une icône pour représenter visuellement le POI sur la carte permet une meilleure identification.
- Distance d'Alerte: Il est possible de configurer une distance d'alerteen mètres. Cette distance définit à quel moment un véhicule est considéré comme ayant atteint le POI pour générer un enregistrement dans le rapport des passages.
- Options d'Alertes Entrée/Sortie: L'utilisateur peut cocher les cases pour activer les alertes d'entréeet/ou de sortie, qui seront enregistrées dans les rapports des passages.
Utilisation Pratique
Cette fonctionnalité permet aux utilisateurs de créer facilement de nouveaux POIen plein écran tout en analysant les trajets historiques d'un véhicule. Une fois le POI ajouté, il sera instantanément visiblesur la carte, et pourra être utilisé dans les futurs rapports de surveillance des véhicules.
Cela permet une adaptation rapidede la carte en fonction des événements ou des changements dans la gestion des points d'intérêt, tout en maintenant une flexibilité maximalepour la gestion des véhicules et des emplacements clés.
Changement de Vue (Satellite/Map) et Zoom
Dans l'interface Recherche Barre, deux fonctionnalités essentielles permettent une meilleure gestion de la visualisation de la carte : Changement de Vueet Zoom.
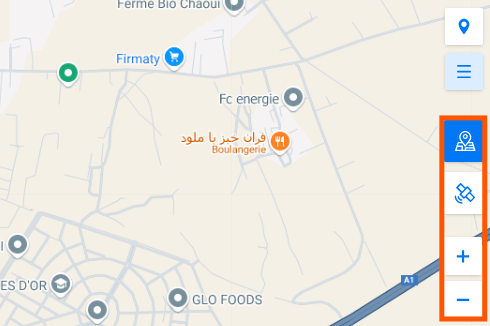
1. Changement de Vue : Satellite ou Map
Cette fonctionnalité vous permet de basculer entre deux modes d'affichage principaux :
- Vue Satellite: Affiche une représentation réaliste du terrain et des bâtiments, utile pour observer des détails précis de l'environnement.
- Vue Map: Offre une vue simplifiée et schématique avec des routes, zones et points d'intérêt clairement indiqués.
Vous pouvez passer de l’un à l’autre à tout moment en fonction de vos besoins, pour une meilleure compréhension de la position des véhicules et points d'intérêt.
2. Fonctionnalité de Zoom
L'interface offre un contrôle précis du zoomavec deux méthodes :
- Boutons + et -: Ces boutons permettent d'agrandirou de réduirela carte de manière progressive. Chaque clic ajuste le niveau de zoom pour obtenir une vue plus large ou plus détaillée.
- Geste de la Souris: En utilisant la molette de la souris ou un geste tactile, vous pouvez également zoomer rapidement et intuitivement sur la carte.