Module · GPS
Ravitaillement Carburant
Ravitaillement Carburant
Introduction
L'interfaceRapport Ravitaillement Carburantest conçue pour fournir unevision complète de tous les ravitaillements en carburanteffectués pour les véhicules de la flotte. Elle permet aux gestionnaires de surveiller et d’analyser en détailles remplissages effectués par les collaborateurs, garantissant ainsi une transparence totale sur l’utilisation du carburant et facilitant le suivi des ressources.
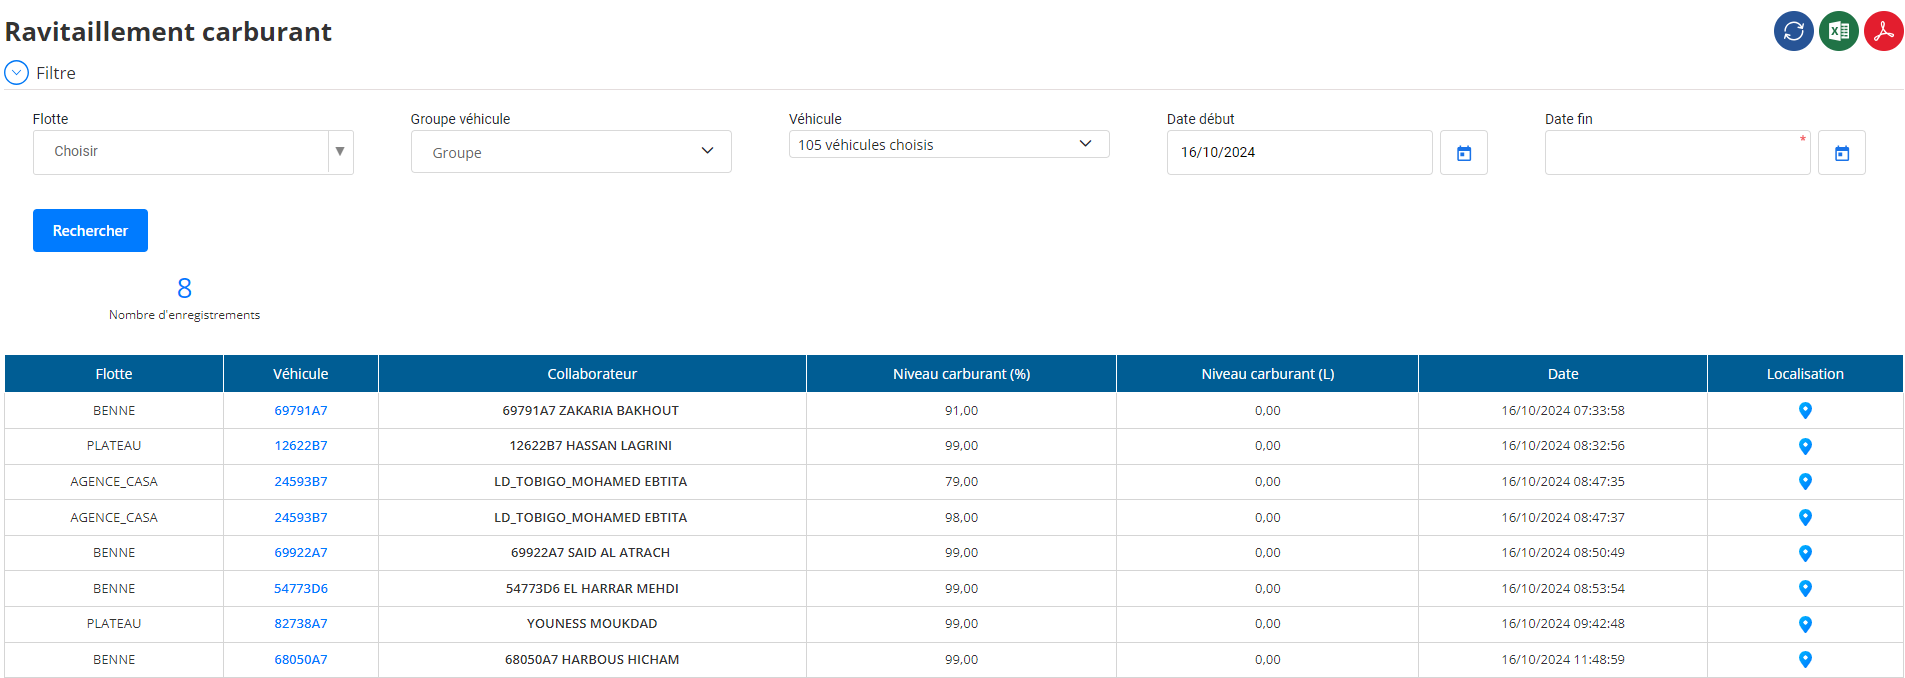
Filtre de Recherche
’interface propose plusieursfiltres de sélectionpermettant d’affiner l’affichage des données :
- Flotte: Sélection d'une flotte spécifique pour une vue ciblée.
- Groupe véhicule: Filtrage par groupe de véhicules pour comparer des sous-ensembles cohérents.
- Véhicule: Affichage des ravitaillements pour un véhicule précis.
- Date de début: Début de la période à analyser (ex. :16/10/2024).
- Date de fin: Fin de la période concernée.
Ces filtres permettent uneanalyse cibléeet facilitent la gestion des ravitaillements par période ou par groupe de véhicules.
Structure du Tableau des Ravitaillements
Le tableau présente les informations clés liées à chaque ravitaillement sous forme de colonnes :
- Flotte: Identifie la flotte à laquelle appartient le véhicule.
- Véhicule: Immatriculation du véhicule ayant effectué le ravitaillement.
- Collaborateur: Nom du conducteur ou de l'opérateur responsable du ravitaillement.
- Niveau Carburant (%): Pourcentage du réservoir rempli après le ravitaillement.
- Niveau Carburant (L): Quantité exacte de carburant en litres après le ravitaillement.
- Date: Date et heure précises du ravitaillement.
- Localisation: Lieu du ravitaillement (adresse ou coordonnées GPS).
Fonctionnalités
-
Visualisation des Données Complètes
- L’interface affiche tous les ravitaillements enregistrés avec des informations détaillées sur la quantité de carburant, l’heure de remplissage, et l’emplacement précis.
- Elle permet de suivre en temps réel l’évolution du niveau de carburant pour chaque véhicule et d’identifier d’éventuelles irrégularités.
-
Suivi Précis des Collaborateurs
- Chaque ravitaillement est attribué à un collaborateur, offrant une meilleure transparence sur les opérations effectuées.
- Ce suivi permet de détecter des comportements inefficaces ou suspects, tels que des ravitaillements trop fréquents ou non planifiés.
- Les gestionnaires peuvent ainsi identifier les collaborateurs nécessitant une formation ou un ajustement dans leur gestion des ressources.
-
Analyse des Niveaux de Carburant
- Le double affichage du niveau en pourcentage et en litres facilite la comparaison entre les quantités réelles de carburant ajoutées et l’autonomie prévue.
- Une analyse rapide permet de repérer des anomalies, comme une consommation plus rapide que d'habitude ou un réservoir qui se vide anormalement.
-
Détection de Fraudes ou d'Erreurs
- Le suivi des localisations garantit que les ravitaillements s’effectuent dans les zones autorisées et évite les abus.
- Des incohérences entre les quantités saisies manuellement et celles enregistrées par le véhicule peuvent révéler des erreurs ou des tentatives de fraude, comme un siphonnage.
-
Optimisation des Itinéraires et du Budget
- L’analyse des lieux de ravitaillement permet d’optimiser les trajets en intégrant des arrêts dans des stations moins coûteuses ou mieux situées.
- La planification stratégique des remplissages aide à minimiser les dépenses en carburant et améliore l’efficacité logistique.
-
Comparaison par Période
- Les filtres de date permettent de comparer les ravitaillements sur différentes périodes (jour, semaine, mois) et d'évaluer les performances globales des véhicules et collaborateurs.
- Cette comparaison aide à identifier des tendances de consommation et à détecter des améliorations potentielles à long terme.
-
Export en PDF et Excel
- L’interface propose une fonction d’export en PDF ou Excel, facilitant le partage des rapports avec d'autres départements ou équipes.
- L’export Excel permet d’effectuer des analyses avancées à l’aide de graphiques et de tableaux croisés dynamiques, offrant une vue plus approfondie des données.
- Ces formats permettent également de conserver un historique des ravitaillements pour référence future et pour les audits.